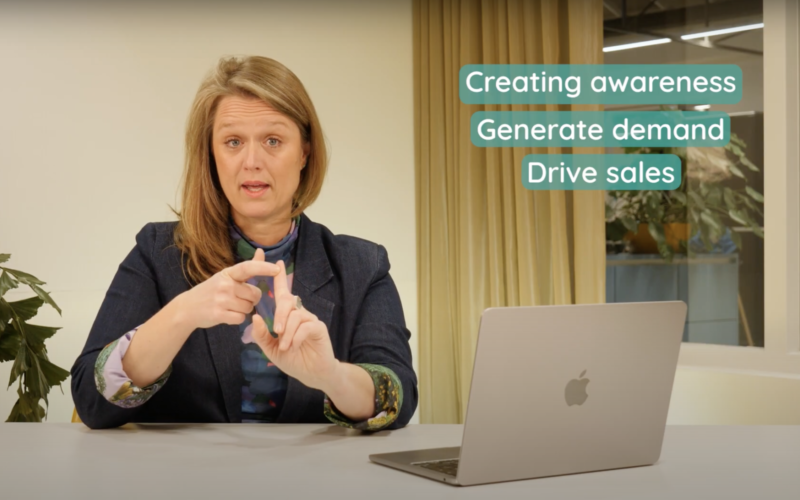
Learn more about campaign statistics
Gain access to comprehensive dashboards for both brands and resellers, offering valuable campaign insights including reach, views, engagement, clicks, and leads generated. Benchmark reports will help you compare shop, ad, and channel performance, while app statistics provide in-depth visibility into how your content is being viewed on the Embrosa mobile brand portal.
 Written by

Embrosa
At Embrosa, we're all a bit nerdy. We love building tech and we're passionate about measuring impact. That's why our Marketing Control Tower™️ includes a dashboard for both brands and resellers. What do we measure and why is it important for you?

Campaign statistics for brands and resellers
Brands can access an automatically updated dashboard in their Marketing Control Tower™️, which displays overall campaign statistics and statistics per channel, ad, and reseller. Resellers have round-the-clock access to simplified campaign statistics about their campaign in the Embrosa App. Additionally, after each campaign, we email every reseller a report containing their individual campaign statistics. What metrics do we track?
Reach
This indicates the number of unique individuals who have seen your ads. Before the start of your campaign, we ensure a certain unique reach on the paid media budget per reseller in your Facebook and Instagram campaign.
Views / Impressions
This represents the number of times your ad has been seen, also known as 'Impressions.' Before the campaign begins, we guarantee a specific number of views on the paid media budget per reseller in your Google and Digital Out Of Home Campaigns.
Frequency
This shows the average number of ads seen on Facebook and Instagram per unique end consumer.
Video Views
This tells you how many people have viewed your video ads and for how long they watched. It also gives an idea of the potential retargeting audience after viewing a certain percentage of your video ads.
Engagement
This encompasses the total number of actions people took on your Facebook page after seeing your ads, such as responding to, posting comments, sharing the ad, claiming an offer, viewing a photo or video, or clicking on a link.
Clicks
This shows the number of people who clicked through after seeing the ad, either to your store's Facebook or Instagram page or on the Call To Action of an ad, redirecting them to the resellers’ website or the personalized landing page of your campaign.
Outbound Clicks
This indicates the number of people who specifically clicked on the Call to Action of your ads.
Landing Page Visitors
This represents the percentage of individuals who landed on your personalized campaign after clicking an Ad on Facebook, Instagram, Google, or YouTube.
Landing Page Click Rate
This represents the percentage of people who clicked on your landing page.
Scroll Rate Landing Page
This shows the percentage of landing page visitors who have scrolled up to 60% of your personalized landing page per reseller.
Generated Leads
This reflects the number of people who have provided their contact details, which we have forwarded to the local reseller for follow-up.

Benchmark Reports
We also provide brands with benchmark reports that show the performance:
- of all shops as compared to each other
- of your ads as compared to each other
- of channels as compared to each other
Shop Benchmark
The Shop-benchmark enables you to analyze the performance of different shops. We discuss these results with you. You know your resellers better than we do.
Together, we can seek to understand the reasons for these differences. Is it due to variations in the audience (age, budget, or location), social media activity, or the campaign's relevance to specific demographics?
Ad Benchmark
The Ad-benchmark shows which ads performed best in generating impressions, video plays, engagement, or clicks.
It helps you understand which content resonates best with your audience and whether there are regional differences. Together, we can analyze which ads work best for each region.
These insights guide you in creating even better campaigns in the future, based on statistics that show the impact of visuals or the type of models based on gender, looks, or age per region.
Channel Benchmark
We will also demonstrate which channels are most effective for building brand awareness and which channels your audience commonly uses to explore further and click through to a reseller's website or campaign landing page.
This will assist you in tailoring your next campaign and developing content for each channel that aligns with your audience's preferences.

Report per shop
Every shop has access to the campaign statistics in the Embrosa App. At the end of the campaign, they will receive a report on app statistics for brands. This PDF report and shows in a few simple graphs how their ads performed.
Sometimes you have to explain them why not all reached end consumers stormed their store to buy your brand. They have to learn that increasing their visibility leads to greater awareness which in turn leads to more in-store shoppers over time.
In-App statistics
Alongside the campaign statistics mentioned earlier, we deliver insightful reports to brand managers and marketers about the usage of the Embrosa App, your powerful brand portal.
The reports enable you to track which resellers have engaged with your social media content in-app, providing comprehensive details such as content views, the most shared content, distribution channels, and individual reseller activity within the Embrosa App.
Do you know about our guarantee?
We guarantee, per reseller, a unique reach (for Meta campaign) or impressions (for Google and DOOH campaigns) on your paid media budget.
We have such confidence in our ability to deliver that we have turned this guarantee into a promise: if we do not meet the guaranteed results, we will refund the cost of launching that campaign. You find more on this guarantee here.
Subscribe to our Linkedin newsletter
by the Friendly Trade Marketer
Use the app to join and manage a brand campaign or use the Embrosa App to find extra inspiration to publish on your social media channels.

Read more about our guarantee
We guarantee impressions on your media budget
If we don’t meet your guaranteed results (which is a guaranteed reach for Meta campaigns and guaranteed impressions for Google and Digital Out Of Home campaigns), we will refund your Embrosa launch fee.

